
Tank dipping: how to calculate fuel stock and spot losses
Dip a tank with a dipstick, read the calibration chart, work out book stock and variance, check deliveries and plan orders, with worked examples.
A full 20,000-litre tank of petrol is about ₦19 million of stock under the forecourt. It is often the station's biggest asset, and yet the least checked: you know what was delivered, you roughly know what was sold, but how much is really left?
Dipping answers that question. Done properly and compared with pump sales, it reveals leaks, short deliveries, counting errors and theft. Below: the method, the calibration chart, the variance calculation and the right habits.
What is tank dipping?
Dipping means measuring the height of fuel in the tank with a graduated dipstick, then turning that height into litres with the tank's calibration chart (dip chart).
You cannot turn height into litres with a simple rule of three: most underground tanks are horizontal cylinders. A centimetre at the bottom or top of the tank holds far fewer litres than a centimetre in the middle. Hence the chart.
The calibration chart
The chart is the table that gives the volume for each height. It comes from the tank manufacturer or installer, or is built by calibration (filling the tank in known quantities and noting the height at each step).
Simplified chart example:
| Height | Volume |
|---|---|
| 500 mm | 4,000 L |
| 1,000 mm | 10,000 L |
| 2,000 mm | 20,000 L |
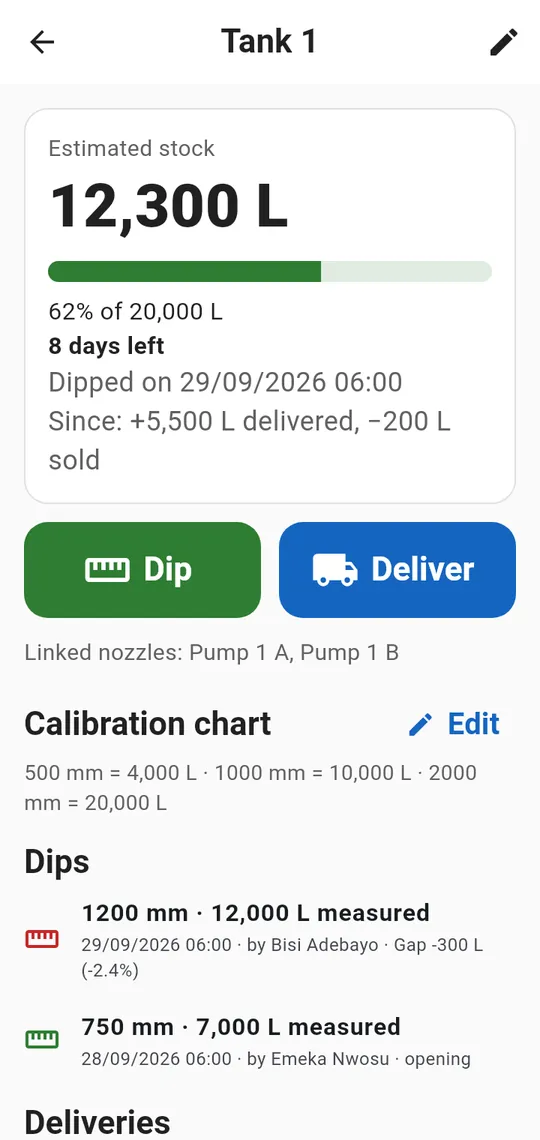
For a height between two points, interpolate. At 1,200 mm, between 1,000 mm (10,000 L) and 2,000 mm (20,000 L): 10,000 + (200 / 1,000) x 10,000 = 12,000 litres.
The more points in the chart, the more accurate the result. A real chart gives a value for every centimetre: between two distant points, interpolating on a cylindrical tank can be off by several hundred litres.
Dipping properly: the method
- Always at the same time, for example at opening, so dips can be compared.
- No sales during the measurement on the nozzles linked to the tank.
- After a delivery, wait for the fuel to settle before measuring.
- A clean, dry dipstick, lowered straight down to the bottom, then read at the edge of the wet mark.
- Check for water at the bottom of the tank with water-finding paste on the end of the dipstick: water sold as fuel is a loss, and a danger for customers' engines.
- Record the height, time and name of the person dipping.
Keep in mind that fuel volume changes with temperature, by about 0.1% per degree: a gap of a few dozen litres between a cool morning and a hot afternoon is nothing unusual.
Working out book stock and variance
Book stock is what should be in the tank according to your figures:
Book stock = last dip + deliveries - sales from the nozzles linked to the tank.
Variance = measured stock - book stock.
Example: yesterday's dip gave 12,000 L. Since then, 5,500 L were delivered and the linked nozzles sold 4,200 L. Book stock = 12,000 + 5,500 - 4,200 = 13,300 L. Today's dip measures 13,100 L. Variance = -200 litres, or -1.5%.
Sales come from the pump meter readings: a wrong reading also distorts the stock. That is why it pays to read the meters carefully.
Checking deliveries
Does the tanker really deliver what the waybill says? To find out, dip before and after offloading, with no sales in between.
Example: before offloading 3,200 L, after offloading 8,650 L. Received = 8,650 - 3,200 = 5,450 L, for 5,500 L invoiced. Variance = -50 litres, or -0.9%.
A one-off gap can come from temperature or dipstick accuracy. Repeated short deliveries from the same supplier or driver deserve a conversation, figures in hand.
What variance is normal?
A small variance, either way, is unavoidable: dipstick accuracy, temperature, evaporation. What should alert you:
- a variance beyond your threshold: set an alert threshold that suits your tanks, for example 1%;
- variances always in the same direction, especially negative, day after day;
- one tank drifting while the others stay stable.
A recurring negative variance can come from a leak, theft, a wrong chart or a faulty pump meter. Read together with meter anomalies and cash shortages, it tells you where to look. See also the warning signs of fuel theft.
Avoid running dry
A dry station loses sales and customers. A tank's cover is easy to work out:
Days of cover = estimated stock / average daily sales.
Example: 12,300 L in the tank, 1,500 L sold per day on average over the last 7 days: about 8 days of cover. Order before you drop below your supplier's delivery time, with a margin.
How Indexa tracks your tanks
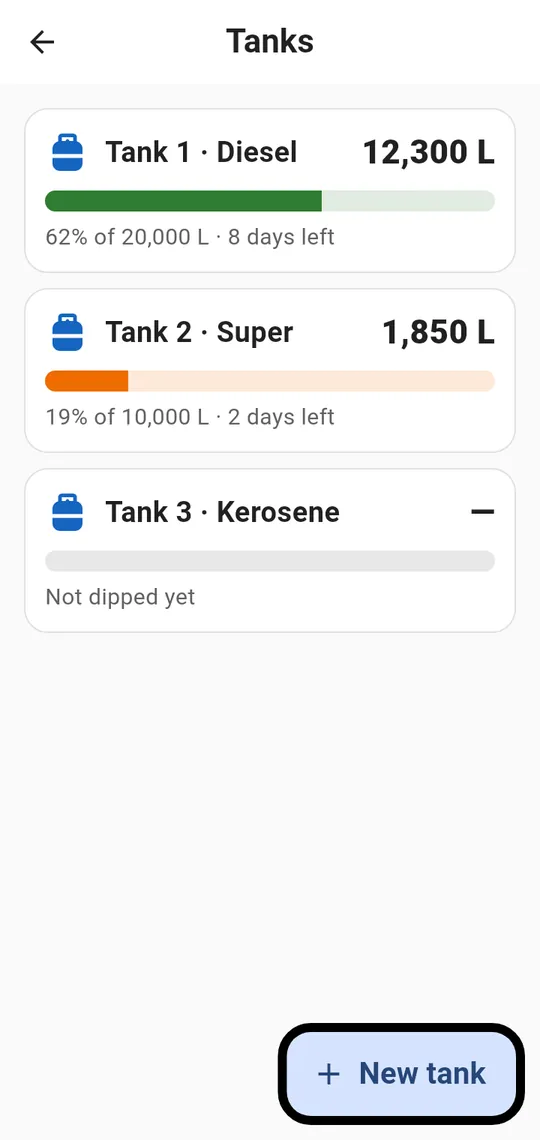
- Each tank has its product, capacity, alert threshold and calibration chart; nozzles are linked to it.
- The forecourt supervisor enters the measured height, Indexa turns it into litres.
- At every dip, measured stock is compared with book stock; beyond the threshold, the manager is alerted.
- Deliveries are checked with a dip before and after offloading.
- Days of cover are worked out over the last 7 days; tanks with less than 3 days or below 15% are flagged in the evening report.
See the details on the tank stock page.